A causal loop diagram is a visual representation of how the variables in the system interact and are related to each other. The diagram consists of a set of nodes and edges. Nodes represent the variables (or stocks) and edges are the links that represent a connection or a relation between the two variables. A link marked positive indicates a positive relation and a link marked negative indicates a negative relation. A positive causal link means the two nodes change in the same direction, i.e. if the node in which the link starts decreases, the other node also decreases.
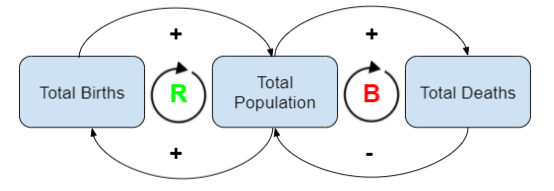
The above system only represents 3 stocks - the total population, total births and total deaths. However, while analysing, for instance, a nation’s GDP, there will be a large number of inter-connected stocks and flows which will decide the behavior of the system. Standard templates like the population growth model (goal seeking), reinforcing model (snowball down a hill, growing economy) act as basic building blocks and help in modeling complicated systems.
Causal Loop Diagrams are excellently represent the internal structure and dynamics of the system. In particular, how stocks behave to changes in other stocks, external factors. Now, that we have tools like, Stocks, Flows, Feedbacks and Causal Loop Diagrams in our arsenal, let us try and analyse a simple one stock system in different scenarios to check how the system responds.
This was a short post, but get ready for a full fledged, simple yet revealing system simulation! Stay tuned!