Hey folks! We are back again; this time, we will analyze an exciting and complex system - a city, better called Urban Dynamics. We will try to model this system - it contains very interesting elements like housing, jobs, economic development, and a lot more.
Acknowledgement: This case study has been borrowed from the course IE604 System Dynamics Modeling and Analysis from the semester of Fall 2022 taught by Prof. Jayendran Venkateswaran at IIT Bombay.
Problem Statement
New town development drives urbanization, especially in developing countries. These new towns can be different designs, functions, and populations; there can be interesting dynamic parallels in their evolution. Prof. Jay W. Forrester, in his now classical work on Urban Dynamics, showed that SD is an appropriate method to understand new town structures and dynamics and to test policies. The description below simplifies and highlights some essential interactions found in Urban Dynamics. The critical sectors represented are the Population, Housing, and Business Structures, with interactions including population-housing interactions, population-business interactions, and business-housing interactions. Land as a fixed limited resource affects housing and business constructions; the Population provides the labor for doing the jobs that are created by the Businesses. The model, when completed, should be able to trace the area’s growth from an early undeveloped stage to a growth stage and into an equilibrium stage within a 50-100 year time horizon.
Part 1
Consider a fixed geographical area that might represent a new town or suburb. Aside from location & climate, housing availability, and job availability are the primary determinants of population growth in the town. The population experiences annual growth driven by births (3% per year) and deaths (1.5% per year) in the town. Also, the town’s housing attractiveness brings new people in at a normal rate of 10% per year (in-migration). Town residents also leave at the rate of 7% per year for various reasons (out-migration). The population drives the desired housing proportionally.
Housing construction continues as long as plenty of land is available for housing. Under these conditions, the housing construction rate will equal 7% per year. As the fraction of landfills up, house construction ceases. Also, when surplus housing exists, builder cut back on construction, and when a shortage of housing is there, the construction rate increases to meet demand. Since the average lifetime of housing units equals ~50 years, the annual demolition rate equals 2%.
The business (or business structures) in the area also responds to land availability. New business constructions/ establishments continue as long as plenty of land is available. Under these conditions, the business construction rate will equal 7% per year. As the fraction of land occupied fills up, business structure construction ceases. Since the average lifetime of business units equal ~40 years, the annual demolition rate equals 2.5%. Businesses (or business structures) provide jobs in proportion to the number of businesses. A fraction of the population will be the labor force. The above description treats each sector independently. That is, it doesn’t really connect the sectors.
Model Description
| Sr. No | Component Name | Component type | Explanation | Initial Value | Corresponding Flows | Units |
|---|---|---|---|---|---|---|
| 1 | Population | stock | number of people in the city | 50000 | Births, Deaths, Inmigration, Outmigration | persons |
| 2 | Houses | stock | number of houses in the city | 14000 | Housing Construction (HC), Housing Demolition (HD) | house |
| 3 | Business Structures | Organization doing economic activity and employing people | 1000 | Business Construction (BC), Business Demolition (BD) | business |
| Sr. No | Component Name | Component Type | Explanation | Expression | Units |
|---|---|---|---|---|---|
| 1 | area per business structure | variable | amount of area required by each business structure | 0.2 | acre/business |
| 2 | area per house | variable | amount of area required to build 1 house | 0.05 | acre/house |
| 3 | Jobs per business structure | variable | number of jobs generated by each business | 18 | jobs/business |
| 4 | labor fraction | variable | fraction of the population working as labor | 0.35 | dimensionless |
| 5 | normal birth fraction | variable | multiplier fraction for birth rate | 0.03 | 1/Year |
| 6 | normal business demolition fraction | variable | fraction of businesses demolished per year | 0.025 | 1/Year |
| 7 | normal business construct fraction | variable | multiplier fraction of newly constructed each year | 0.07 | 1/Year |
| 8 | normal construction fraction | variable | multiplier fraction for construction of new units each year | 0.07 | 1/Year |
| 9 | normal death fraction | variable | multiplier fraction of population for number of deaths per year | 0.015 | 1/Year |
| 10 | normal demolition fraction | variable | multiplier fraction for demolished units each year | 0.02 | 1/Year |
| 11 | normal inmigration fraction | variable | multiplier fraction for population, total immigration each year | 0.1 | 1/Year |
| 12 | normal outmigration fraction | variable | multiplier fraction for population, total outmigration each year | 0.07 | 1/Year |
| 13 | Persons per House | variable | number of residing per house | 4 | Person/House |
| 14 | total land | variable | total available | 1000 | acre |
Note: Use a final simulation time of 60 years, with a time step of 0.25.
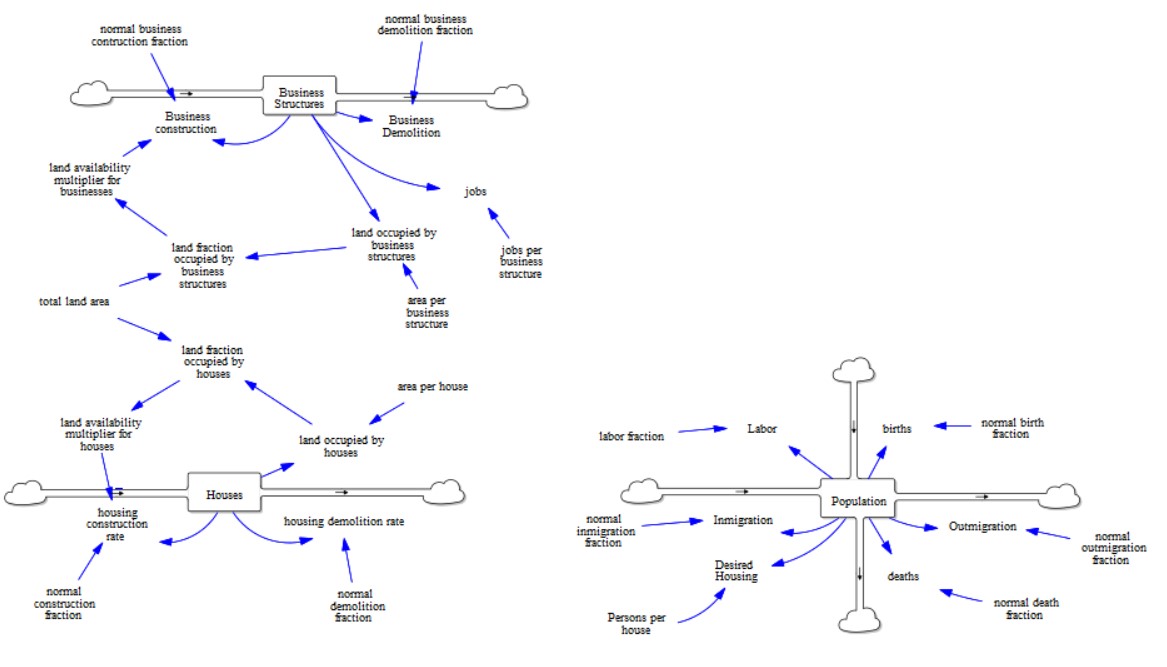
Problem 1
The SFD model has been given as follows. We need to mark the links and loops with polarities and types. Link polarities can either be + or -, and loop types can either be B or R, i.e., balancing or reinforcing.