By now, you must have realized that systems respond to stimuli differently based on the situation, time, and inherent structure. Systems evolve with time; even if they are made of inanimate objects, they tend to learn to respond optimally and display dynamic behavior. System Dynamics is a discipline that develops modeling methods for the inherent structure of the system to know more about how it works and make predictions based on hypothetical stimuli.
Let’s take a simple example of how a country’s population, or, for that matter, the world population, behaves with time. To put this forward intuitively, we will use a lot of block diagrams and illustrations; I will describe each of them as we go along! Let’s get started.
We usually use the so-called Stock and Flow diagrams to analyze how a system behaves with time.
What are Stocks, then?
You can think of stocks as inventories or storehouses of any product, be it a car, a bicycle, or a living being. If you are analyzing a system and taking a snapshot by freezing variables in time, stocks are the values of that variable. Consider a bank account; here, the account balance is a stock, and inflows and outflows are income and expenditure, respectively. Stocks needn’t be of material quantities; abstract variables like happiness and emotions can also be represented in stocks. Stocks, in a more technical lingo, can be described as the history of changing flows within the system.
What are Flows?
Flows are measured over an interval of time and are responsible for changing the stock values. Flows can be of 2 types, sources and sinks. For a storehouse, the source is the inflow of produce from the manufacturing units. The outflow is due to consumer demand, testing, market survey, etc. For instance, if the number of cars in a parking lot is in stock, the number of cars entering the lot every hour is the inflow, and the cars leaving each hour is the outflow.
The Population Model
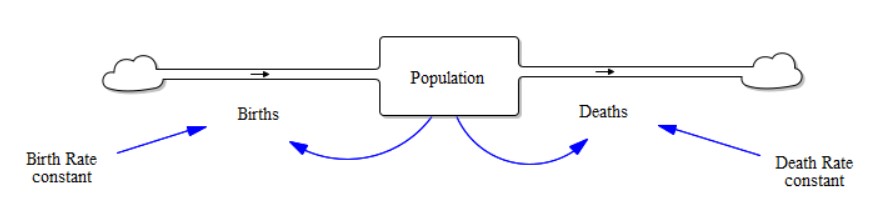
Consider this simple stock and flow model, representing a population of certain species - it can be humans, plants, or any other. Note that the model is very simplistic in nature and only serves at best to produce qualitative results. The clouds in the diagram lie beyond the system under consideration - or they can be considered as other stocks - however, we don’t consider their dynamics - hence you might even want to consider them as infinite stocks.
The model has 2 flows; the ‘Birth Rate’ is the inflow, whereas the ‘Death Rate’ is the outflow. They both increase or decrease the stock value and influence the dynamics. There are two more variables called ‘Birth Rate constant’ and ‘Death Rate constant.’ Note that I call them variables and not stocks. There are 2 reasons behind this premise:
- The variables represent constant values within the model
- They are deemed to be constant for this model since we are not interested to examine their dynamics because either that is out of scope or they don’t influence the model that much to be considered relevant.
This can be better understood using the concept of Modeling Depth you are targeting to achieve within your model. We will talk about ‘system modeling depth’ in detail later on. For now, we will focus on how we define this model completely and perform some simulations to get some meaningful results.
Defining the Model
Before we go on and define the model with values and units, this model has been created in software called Vensim, which is exclusively made for constructing system dynamic models and has an excellent visual interface and tools to make the process easier. More information on Vensim can be found here: https://vensim.com/
Now, here are some essential traits each model should possess. You should make sure to check and put these parameters in place before running simulations.
- Start time of the model or the initial time; note that System Dynamics inherently uses time as the independent variable.
- End time of the model, or the final time, the time till you want the model to be simulated
- Time step, the time interval for the numerical integration: Note that System Dynamics uses numerical integration methods like Euler’s method or the Runge Kutta-4 algorithm. Hence the time step can be a critical parameter to ensure the stability of the model and rule out unphysical results.
- Time unit: Time can be measured in seconds, hours, days, months, weeks, years. Time units should be appropriately chosen according to the context of the model under question. For instance, if the model is based on economic forecasts, then ‘quarters’ (3 months_ would be the best unit for simulation since most of the economic data is published every quarter.
- Initial Value of all Stocks: Stocks are the history of changing flows within the system; they are integrals of the net flows. Hence an initial value is essential to produce accurate results.
- Formulae/Expression of All stocks, flows, and variables: You can custom define expressions for stocks, flows, and variables. You can set a flow to be of constant value, or to be a product of the current stock value and another factor, or anything else too.
- Dimensions of all Stocks, flows, and variables: System Dynamics is very particular about units. Vensim, too flags errors if there are any discrepancies in units. Hence you should give appropriate units to each component and conduct a dimensional analysis for the same.
Model Simulation
We make a simple model for the purpose of illustration.
- Population: init_val = 1000, expression: INTEGRAL(Births - Deaths), units: units
- Births: expression: Population*Birth Rate Constant, units: units/month
- Deaths: expression: Population*Death Rate Constant, units: units/month
- Birth Rate Constant: expression: 0.1, units: Dimensionless
- Death Rate Constant: expression: 0.05, units: Dimensionless
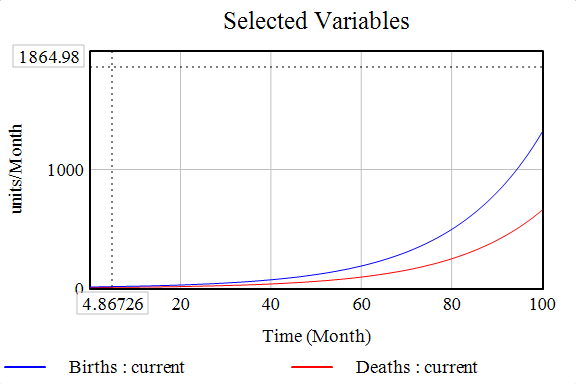
With these model definitions, let’s take a look at the trends:
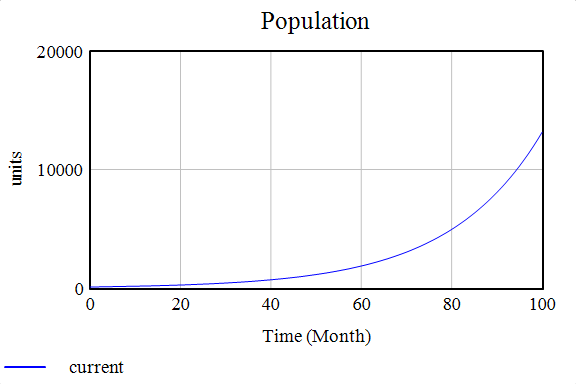
Just as in our population model (to a first approximation), we know the number of births is governed by the number of individuals capable of reproducing, which are directly proportional to the population, as is the number of deaths since a larger population means a more significant number of deaths. Of course, this simplistic model is not enough to fit real-world data and prove any practical use; however, it is a great learning tool to envision how large dynamical systems work and interact together.
Here’s a small task for you now; I want you to play around with the values of the constant and check how the stocks and flows behave. Check what happens when the birth and death rate constants are equal or if the death rate constant is larger.
That’s all for this time, folks! Stick around as we get into detailed conversations about system dynamics and make more complex models.